12 Housing Markets Where Sellers Are Slashing Prices the Fastest Heading Into 2027
After years of bidding wars, sellers across large parts of the country are now cutting their asking prices at a pace not seen in years, and the trend is accelerating as 2026 winds down.

Lance Asper/Unsplash
America’s housing market has quietly flipped. After years of bidding wars, sellers across large parts of the country are now cutting their asking prices at a pace not seen in years, and the trend is accelerating as 2026 winds down.
The numbers are hard to ignore. Redfin reported in mid-October that 22% of home sellers with active listings had cut their asking price in the four weeks ending October 11, the highest share in its records. Realtor.com found that 20.8% of listings carried a price reduction in September, the highest September reading since 2018, and Zillow put the figure even higher at 27.4% of listings.
Meanwhile, buyers are stepping back. Redfin says pending home sales fell to the lowest level in its records (which date back to 2021) in the four weeks ending October 18, as the typical monthly mortgage payment climbed to about $2,796 with rates near 7.4%. Zillow’s Market Heat Index shows buyers now hold the advantage in 38 of the 50 largest metros.
But the pain is not spread evenly. In some metros, roughly one in three homes for sale has already been marked down. Here are the 12 large housing markets where sellers are slashing prices most aggressively, ranked by the share of listings with a price cut in Realtor.com’s September 2026 data, the most recent complete monthly snapshot of the 50 largest U.S. metros.
12. Seattle, Washington

Listings with a price cut: 25.0% (up 4.4 points from a year ago) Median list price: $749,970 (down 2.4%)
Seattle ties Las Vegas for the No. 12 spot, but no market on this list is deteriorating faster. Its share of price-reduced listings jumped 4.4 percentage points in a year, one of the three biggest increases among the 50 largest metros. Inventory is the reason: active listings are up 28.5% from a year ago while new listings are down 7.4%, meaning homes are sitting rather than selling. Redfin data shows Seattle posted the steepest drop in pending sales of any major metro in September, and the slump deepened into October. Redfin has pointed to a shaky local job market on top of high prices as the drag on demand.
11. San Antonio, Texas

Listings with a price cut: 25.4% (down 1.9 points) Median list price: $320,374 (down 2.9%)
San Antonio is one of the few markets here where price cuts are actually becoming slightly less common, and that’s because sellers there started cutting early. The metro has carried one of the country’s highest price-cut shares for well over a year, and Redfin’s late-September data still ranked it third among large metros at 26.8%. Prices per square foot are down 3.5% from a year ago, and inventory is up 6%. For buyers, it remains one of the most affordable big metros in the country with substantial room to negotiate.
10. Charlotte, North Carolina

Listings with a price cut: 26.2% (up 0.7 points) Median list price: $424,950 (down 3.1%)
Charlotte spent much of the decade as a magnet for relocating buyers, but the math has shifted. Active listings are up 10.3% from a year ago even though new listings fell 7.5%, a sign that the homes already on the market are taking longer to move. Homes are spending about six more days on the market than a year ago, and more than a quarter of listings have been reduced. Zillow data shows Charlotte’s typical home value has slipped 1.2% over the past year.
9. Austin, Texas

Listings with a price cut: 27.3% (down 0.3 points) Median list price: $446,450 (down 9.8%)
Austin isn’t just cutting prices; it’s leading the country in actual price declines. Its median list price fell 9.8% year over year, and price per square foot dropped 8.4%, the largest decline among the 50 largest metros. Zillow’s September report found Austin’s typical home value down 3.9% from a year earlier to about $416,000, again the steepest drop of any major metro. Nearly a decade of overbuilding during the tech boom left Austin with more supply than buyers can absorb at today’s mortgage rates.
8. Tampa, Florida

Listings with a price cut: 27.5% (up 0.6 points) Median list price: $385,398 (down 6.6%)
Tampa is Florida’s weakest major market on price. Its median list price is down 6.6% from a year ago, and its price per square foot fell 6.0%, the second-biggest drop among the 50 largest metros behind Austin. Soaring homeowners insurance costs, rising condo association fees and hurricane risk have pushed many would-be buyers to the sidelines, and more than one in four sellers have responded by lowering their price. Notably, inventory is down 3.8% from a year ago, meaning the cuts reflect weak demand rather than a flood of new listings.
7. Dallas-Fort Worth, Texas

Listings with a price cut: 27.5% (unchanged from a year ago) Median list price: $422,495 (down 0.6%)
The Dallas-Fort Worth area has become one of the strongest buyer’s markets in the country. More than 27% of listings had a price cut in September, the same share as a year earlier, so this is a market that has settled into a sustained slowdown rather than a new one. Redfin’s late-September data placed Dallas in the top five large metros for price drops at 26.6%, with Fort Worth close behind at 24.2%. Prices are holding roughly flat overall, but sellers who list too high are routinely forced to come down.
6. Columbus, Ohio

Listings with a price cut: 28.8% (up 0.7 points) Median list price: $374,950 (unchanged)
Columbus is the surprise on this list. Most Midwestern markets have held up well, and Columbus’ median list price hasn’t budged from a year ago. But inventory is up 13.8% and new listings are up 3.5%, and that wave of supply has forced more sellers to adjust. The pattern here is less about collapsing values and more about sellers who priced for last year’s market and are now meeting buyers in the middle.
5. Phoenix, Arizona
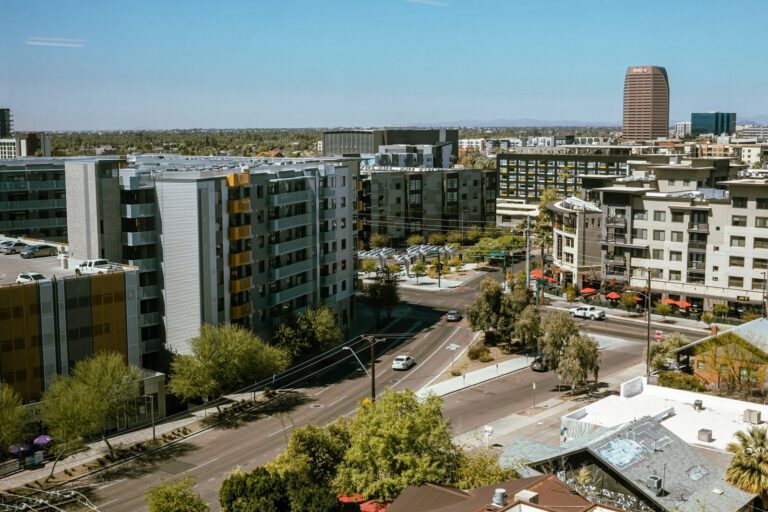
Listings with a price cut: 29.0% (up 2.0 points) Median list price: $475,000 (down 4.8%)
Phoenix is heading back toward the conditions that made it a cautionary tale in past downturns. Nearly three in 10 listings carry a price reduction, up 2 points from a year ago, while the median list price is down almost 5%. Inventory has risen 7.5% and new listings are up 3.6%, so supply is growing on both ends. Phoenix was one of the biggest pandemic boomtowns, and it’s giving back some of those gains as higher rates sideline buyers.
4. Indianapolis, Indiana

Listings with a price cut: 30.5% (up 0.8 points) Median list price: $310,000 (down 4.1%)
Indianapolis tells a more complicated story. Its price-cut share is the fourth highest in the country, and Redfin ranks it second only to Denver, classifying it as a buyer’s market. Inventory has jumped 19.9% in a year. Yet price per square foot actually rose 4.7%, one of the biggest gains among large metros. That gap suggests more smaller, cheaper homes are hitting the market and that sellers are trimming optimistic asking prices rather than the market’s underlying values falling. Buyers still have plenty of leverage.
3. Portland, Oregon

Listings with a price cut: 31.6% (up 1.3 points) Median list price: $587,750 (down 1.9%)
Nearly one in three homes for sale in the Portland metro has been marked down. Unlike many markets, Portland is seeing more sellers list, with new listings up 4.4% and active listings up 6.9%, which keeps the pressure on asking prices. Pacific Northwest markets as a whole are among the weakest in the country right now, with both Portland and Seattle seeing price cuts climb as buyers balk at high prices and high rates.
2. Denver, Colorado

Listings with a price cut: 32.1% (up 1.3 points) Median list price: $569,900 (down 4.9%)
By Redfin’s count, Denver has the highest share of price-reduced listings of any large U.S. metro at 30.9%, up 3.1 points from a year ago. Realtor.com puts it at 32.1%, second only to Salt Lake City. Denver’s median list price is down nearly 5% from a year ago. Interestingly, fewer sellers are listing (new listings fell 5.9%), yet inventory is still up 6.7% because homes aren’t selling. Redfin also reported Denver pending sales down 21% from a year earlier in October, one of the sharpest drops in the country.
1. Salt Lake City, Utah

Listings with a price cut: 33.6% (up 6.9 points) Median list price: $564,950 (down 3.6%)
No large housing market in America is cutting prices more aggressively than Salt Lake City. One in three listings now carries a price reduction, and that share has jumped 6.9 percentage points in a single year, by far the largest increase among the 50 largest metros. Inventory is up 14.1% and new listings are up 4.2%, while the median list price has dropped 3.6%. Salt Lake City was one of the hottest markets of the pandemic era, and it is now leading the country’s correction.
What This Means Heading Into 2027

A price cut is not the same thing as a crash. Most of these markets are still seeing modest declines in actual home values, not double-digit drops, and a reduction often just means a seller started too high. But the direction is clear: buyers are gaining leverage, inventory is climbing back toward pre-pandemic levels, and sellers in the West, Texas and Florida are under the most pressure.
The big question for 2027 is whether the cuts bring buyers back. Realtor.com’s economists say they are watching whether deeper or repeated reductions translate into more signed contracts, and whether frustrated sellers begin pulling their homes off the market. With mortgage rates hovering above 7% and pending sales at record lows, the pressure on sellers is unlikely to ease quickly.
For buyers: In markets like Salt Lake City, Denver and Austin, offering below asking price, asking for seller-paid closing costs or a mortgage rate buydown is increasingly realistic.
For sellers: Pricing correctly from day one matters more than ever. Listings that start too high tend to sit, collect cuts and ultimately sell for less.
Methodology

Markets are ranked by the share of active listings with a price reduction in September 2026 among the 50 largest U.S. metropolitan areas, from Realtor.com’s September 2026 Monthly Housing Trends Report. Seattle and Las Vegas tied at 25.0%; Seattle is listed for its larger year-over-year increase. Median list prices, inventory and year-over-year changes come from the same report. Supporting data comes from Redfin’s weekly housing market updates (four weeks ending September 20, October 11 and October 18, 2026) and Zillow’s September 2026 Market Report.